Sandro Sousa
Complexity & Network Scientist
Copenhagen Center for Social Data Science (SODAS), University of Copenhagen
Copenhagen Health Complexity Center University of Copenhagen
About me
Sandro is a multidisciplinary researcher grounded in complexity and network science. He is driven by a curiosity to understand the mechanisms behind issues emerging from population dynamics, merging breadth and depth of knowledge for a pluralist approach. His vision is to use this curiosity drive and science to help the most vulnerable in society by understanding socioeconomic inequalities.
He draws approaches from a wide multidisciplinary toolset, including network science, stochastic processes, computational simulations, randomised trials, surveys, text as data, web scraping, and spatial analysis. His research spans topics of ethnic segregation, epidemic spreading, health image classification, unequal incidence of epidemics, spatial complexity, and gender inequalities in science. Currently, he is an Assistant Professor at the Copenhagen Center for Social Data Science (SODAS), University of Copenhagen. He is also affiliated with the Copenhagen Health Complexity Center.
He has a PhD in Complex Systems at The School of Mathematical Sciences, Queen Mary University of London, with supervision by Vincenzo Nicosia. He obtained his MSc in Complex Systems Modelling at University of Sāo Paulo. Before the research career, he worked on IT consulting and data solutions for more than 7 years.
- Complex Networks
- Spatial Complexity
- Science of Cities
- Computational Social Science
- Socioeconomic inequality
- Climate-induced population dynamics
- Algorithms & Society
-
PhD in Mathematical Sciences, 2021
Queen Mary University of London
-
MSc in Complex Systems Modelling, 2015
University of Sao Paulo
-
PG Cert in Information Management and Business Intelligence, 2013
Business School Sao Paulo
-
BSc in Computer Network Management, 2008
College Inforium of Technology
Experience
Recent Publications
Selected Publications

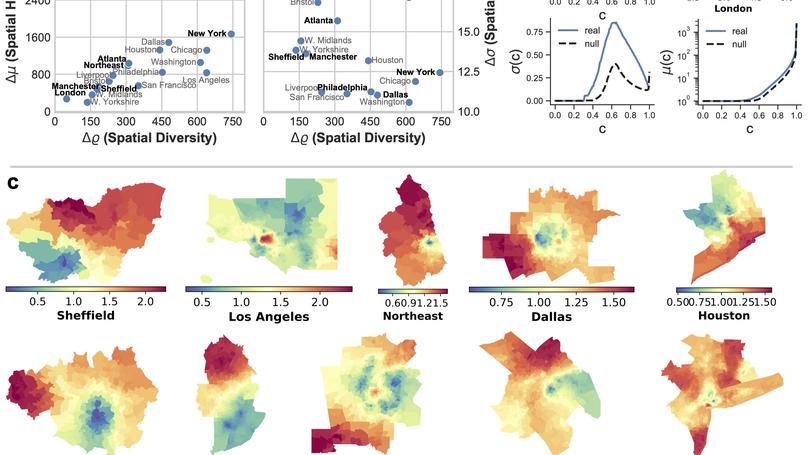
Socioeconomic segregation is one of the main factors behind the emergence of large-scale inequalities in urban areas. We propose two non-parametric measures of spatial variance and local spatial diversity, based on the statistical properties of the trajectories of random walks on graphs. We analyse the segregation of synthetic systems and large metropolitan areas in the US and the UK and our results confirm that the spatial variance and local diversity as measured through simple diffusion on graphs provides meaningful insights about the spatial organisation of ethnicities across a city.

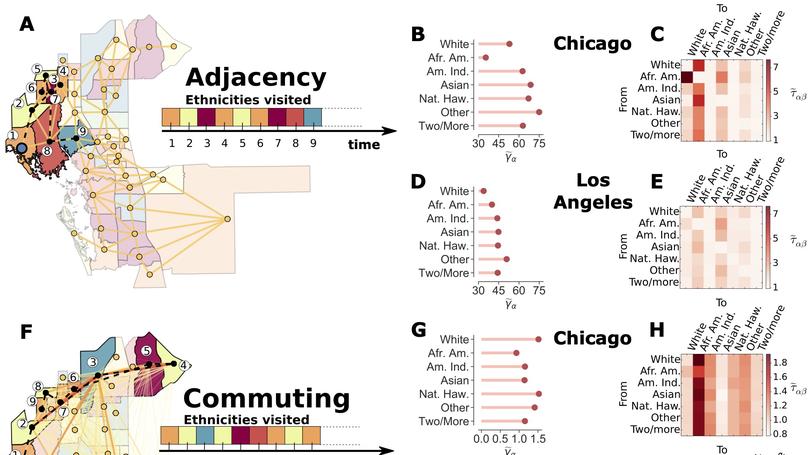
The ongoing COVID-19 pandemics disproportionately affects people from Black and African American backgrounds. We propose a model to quantify the dynamic segregation of ethnicities in a city, based on passage times and coverage times of random walks on graphs. The results confirm that knowing where people commute to, rather than where they live, is potentially much more important to contain and curb the spreading of infectious diseases.
Academic Activities
Research Visits
- Complexity Science Hub, Vienna, AT, Apr 2024
Conference abstracts (Oral presentations and Posters)
-
Danish Digitalization, Data Science and AI 1.0 (D3A)
Poster: Scientists’ gender drives different citation outcomes in Randomized Web Experiments. Copenhagen, DK, Feb 2024 -
Conference on Complex Systems (CCS) Scientists’ gender drives different citation outcomes in Randomized Web Experiments. Salvador, BR, Oct 2023
-
International Conference on Comp. Social Science (IC2S2) Lightning talk: Quantifying ethnic segregation in cities through random walks.; Parallel: The impact of COVID-19 on scientific productivity and collaboration. Copenhagen, DK, Jul 2023
-
2nd Nordic Network for the Science of Science (NordicSciSci) The impact of COVID-19 on scientific productivity and collaboration. Athens, GR, Dec 2022
-
Conference on Complex Systems (CCS) The emergence of segregation driven by mobility and homophily. e-Conference, GR, Dec 2020
-
Conference on Complex Systems (CCS) Quantifying spatial heterogeneity through random walks. Thessalokini, GR, Sep 2018
-
Complex Systems Digital Campus’15 – World Empirical analysis and modelling of urban public transport network of Sao Paulo. e-Conference, US, Sep 2015
Special Educational Support
- Provided academic support to students at ITU, DK, 2022/2023
Teaching
I’ve been Demonstrator for the following courses:
- 2023 - Advanced Social Data Science I, Social Network Analysis classes, UCPH.
- 2019 - 2020 Introduction to Computer Programming in Python (MTH5001), QMUL.
- 2018 - 2019 Probability and Statistics I (MTH4116/MTH4216), QMUL.
Supervision
- Cluster of 6 M.Sc. students, Co-supervisor. UCPH, DK, 2024
- Camilla Veronica Branas (M.Sc.), Principal supervisor. UCPH, DK, 2023
- Anton Folkmann and Alexander Hjelmgaard (B.Sc.), Co-supervisor. ITU, DK, 2023
- Chiara Zappalà (Visiting PhD), Co-supervisor. ITU, DK, 2022
- Maria Elena Perruzza (External M.Sc., ISI Foundation), Co-supervisor. ITU, DK, 2022
Resources
Software, books, websites, datasources, etc. Resources arbitrarily categorised.
Useful software
Network analysis
Graph-tool |
NetworkX |
igraph |
SNAP Stanford Network Analysis Project |
OSMnx Street networks |
Hive Plots |
NetBunch
Network analysis - no coding
Cytoscape |
Gephi
Large networks analysis
Large Network Visualization Tool |
Multinet Large multi-layered graphs |
Cosmograph Visual analytics for big graphs
Other
Power-law Distributions |
GNU Parallel, Shell tool for jobs in parallel
Tutorials
Network analysis with R and igraph: NetSci Tutorial |
Static and dynamic network visualization with R |
Temporal networks with R and igraph |
Network Analysis Made Simple
Visualising and representing Data
Plotting
Matplotlib Parts of a Figure |
Python_Matplotlib_Cheat_Sheet |
Colormaps in Matplotlib |
List of named colors Matplotlib |
Choosing color palettes seaborn |
ColorBrewer Color Advice for Maps |
Create a palette Coolors |
What to consider when choosing colors
Data Art
Kirell Benzi |
Information is Beautiful Awards |
Data design and storytelling Tiziana Alocci
Data viz
Chartable |
Find the graphic you need |
Free Logo Maker |
scientific-visualization-book |
Redundant coding, text annotations |
Streamline Icon Library |
That ole Illustrator magic |
The Python Graph Gallery
Datasources
Network
Index of Complex Networks |
Netzschleuder the network catalogue |
Network Data Repository |
KONECT The Koblenz Network Collection |
Stanford Large Network Dataset Collection
General
BlackDemographics US |
Colouring London |
data.europa.eu |
Datasets UBDC Data Portal |
GoodCityLife |
SoBigData.eu |
Metroverse Harvard Growth Lab |
Office for National Statistics |
OpenAlex The open catalog to the global research system |
QuantUrb |
DataShine Census |
Our World in Data |
Humanitarian Data Exchange
Maps
Overpass turbo |
TIGER/Line® Shapefiles |
IPUMS NHGIS | National Historical Geographic Information System |
Mapzen
Transit
TransitFeeds |
Transitland
Free reading material
Network Science
Glossary of graph theory terms |
Network Science book by A. Barabási |
The Atlas for the Aspiring Network Scientist
Complexity
Complexity Explorer |
Think Complexity 2e |
Complexity Explained |
Complexity Digest |
Complexity Explorables
Maths
3blue1brown |
Encyclopedia of Mathematics |
Guide To The Fourier Transform |
List of mathematical symbols |
Random: Probability, Mathematical Statistics, Stochastic Processes |
Wolfram Alpha |
Sybolab math solver
Other collections
Awesome lists
awesome-network-analysis |
awesome-understanding-math |
awesome-math |
awesome-dataviz |
awesome-datascience |
awesome-computational-social-science |
awesome-python |
awesome-causality |
awesome-nlp |
speech-language-processing |
awesome-open-science |
awesome-quarto
Contact
- University of Copenhagen, Øster Farimagsgade 5, København, 1353
- Office: SODAS
- Mon - Fri: 09:00 - 17:00
- Book an appointment
